Data posters
This section is for data posters: large maps that show one dataset across a whole city or region. The first two are about cycling in London. The first looks at how well the cycle tracks join up, and the second at where cyclists are killed or seriously injured.
01 · London, connected?
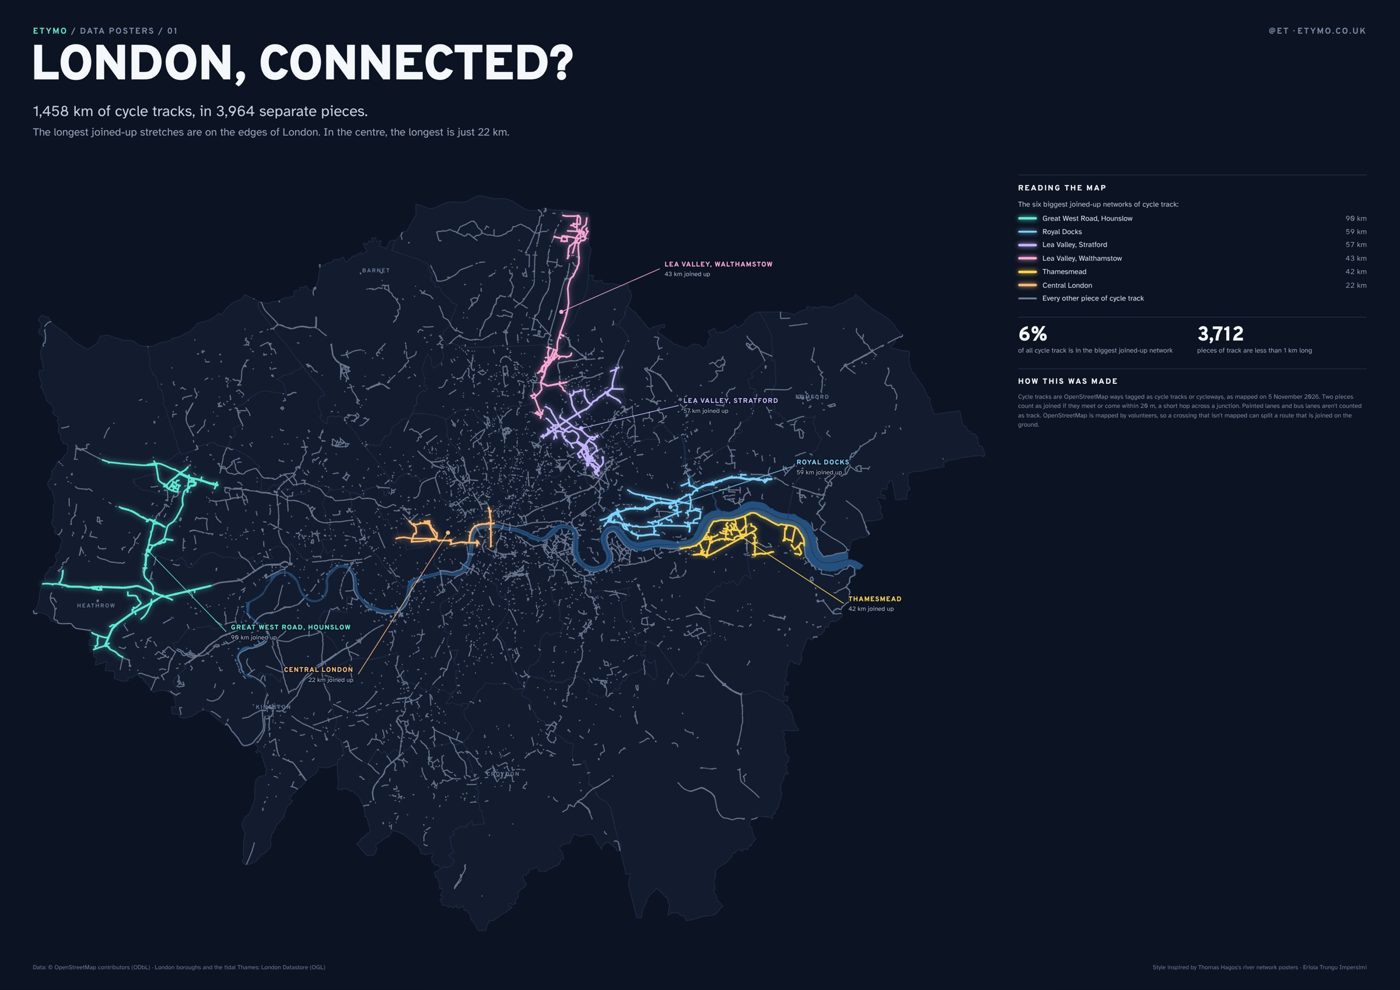
London has 1,458 km of cycle tracks separated from traffic, but I wanted to know how much of it you can actually ride without leaving it. I joined up every piece of track that meets another, or comes within 20 m of it (a short hop across a junction), and ended up with 3,964 separate networks. The biggest one is 90 km, along the Great West Road near Heathrow, and that is only 6% of all the track. The other long ones are also on the edges of London: the Royal Docks, the Lea Valley and Thamesmead. In central London the longest is 22 km, from Hyde Park to Farringdon. 3,712 of the pieces are shorter than 1 km.
Prints are available to buy: see the About page to get in touch.
02 · Where cyclists get hurt
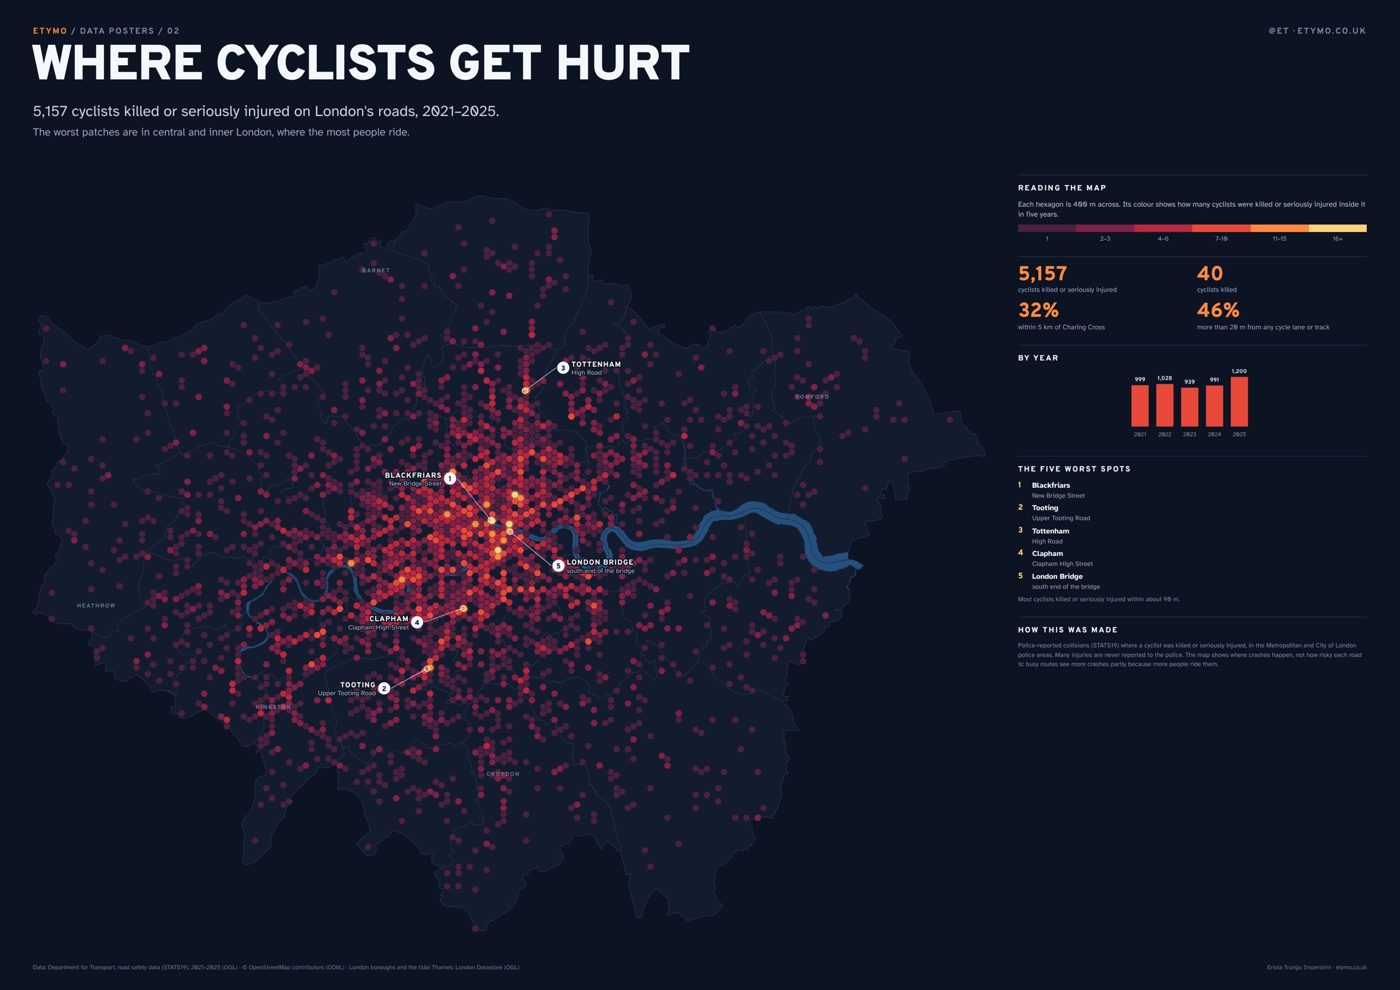
Between 2021 and 2025, 5,157 cyclists were killed or seriously injured on London’s roads, and 40 of them died. I counted them in 400 m hexagons. The highest numbers are in central and inner London, around Blackfriars and London Bridge, and on busy high streets like Upper Tooting Road, Clapham High Street and Tottenham High Road. 46% of these cyclists were hurt more than 20 m from any cycle lane or track.
Prints are available to buy: see the About page to get in touch.
Reading them together
Looking at the two posters side by side, the long joined-up tracks are mostly on the edges of London, where there are fewer serious injuries, while the centre has short pieces of track and the most injuries. I can’t say from this that the tracks are the reason. More people cycle in central London, so more people get hurt there, and there isn’t open data on how many people cycle on every street to account for that. What I can say is that the places where most people cycle are the ones with the least joined-up track.
How these were made. Cycle tracks are OpenStreetMap ways tagged as cycle tracks or cycleways, downloaded on 5 November 2026; painted lanes and bus lanes aren’t counted as track. OpenStreetMap is mapped by volunteers, so a crossing that isn’t mapped can split a route that is joined on the ground. Collisions are police-reported (STATS19) in the Metropolitan and City of London police areas, 2021–2025; many injuries are never reported to the police.
If you would like a print, or a poster like this with your own data, you can find my email on the About page.