Andros on one page: rebuilding my island map, seven years on
Back in 2019, during my MSc in Geoinformatics, I made a set of maps of Andros. I collected the base data from free online sources, created the digital terrain models myself and designed two printed maps at 1:150,000, one with contours and one with hypsometric tints and hillshading. I also made a web version, served through GeoServer with OpenLayers on top.
It worked well for the course. But it needed a map server running all the time, a styling file for every layer and someone to look after it. That’s not something a small island can realistically keep going.
What was missing
Before starting, I had a look at what’s already out there. The Municipality of Andros publishes its maps as static images. The best interactive maps of the island come from others: Andros Routes, a non-profit, looks after the trail network, and there are hiking maps you can buy. What I couldn’t find was a simple, free map of the whole island that also gives coordinates in the Greek Grid (ΕΓΣΑ87), the system local engineers work with.
The map
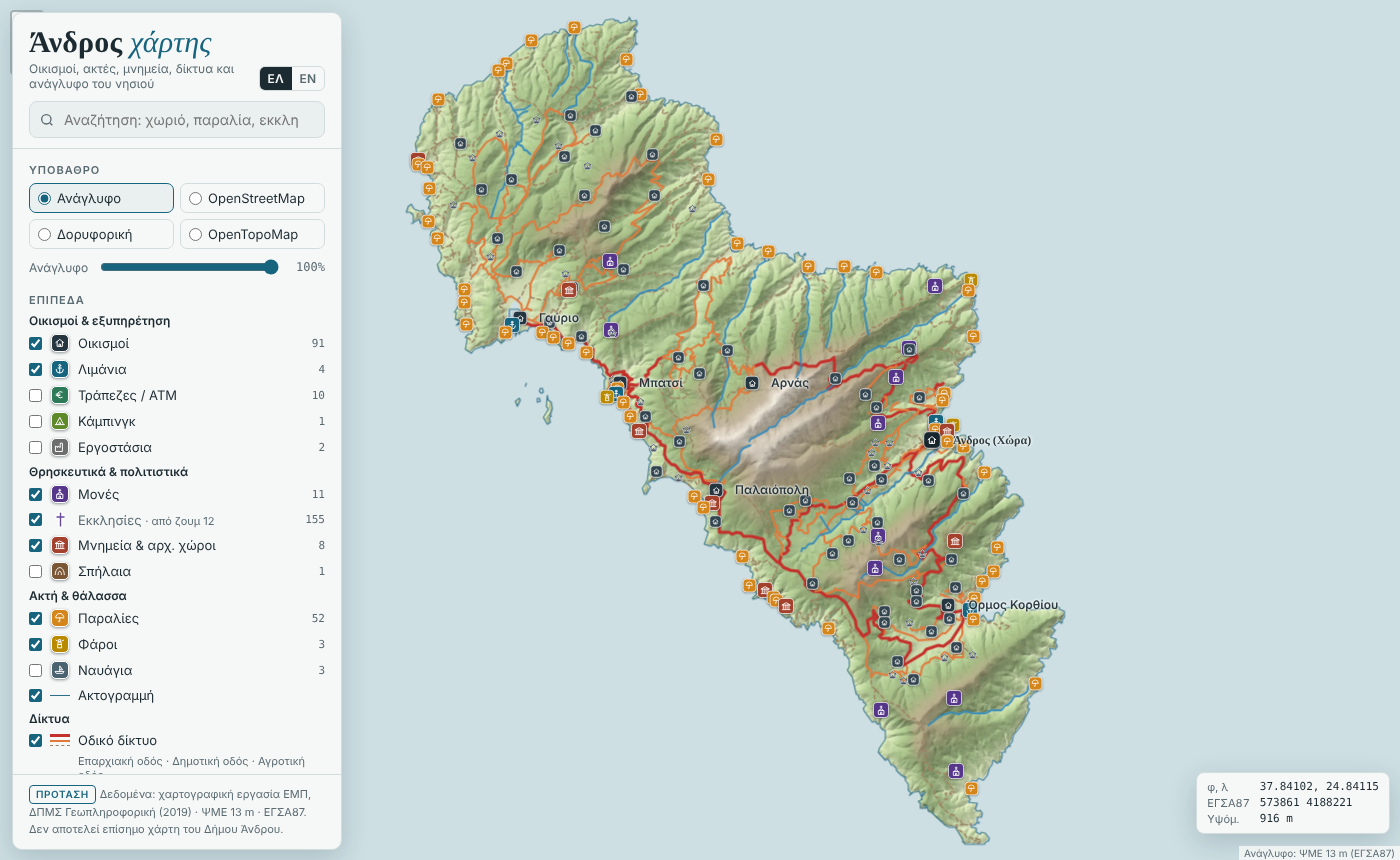
The new version is one web page, with no server behind it:
- Relief first. The 13 m terrain model and the hillshade are blended into one relief image, so you can read the shape of the island straight away.
- Names that suit the zoom. The generalised 1:150,000 settlements from 2019 decide which village names you see when you zoom out, so that work is still being used.
- Click anywhere to get the elevation and the coordinates in both WGS84 and ΕΓΣΑ87.
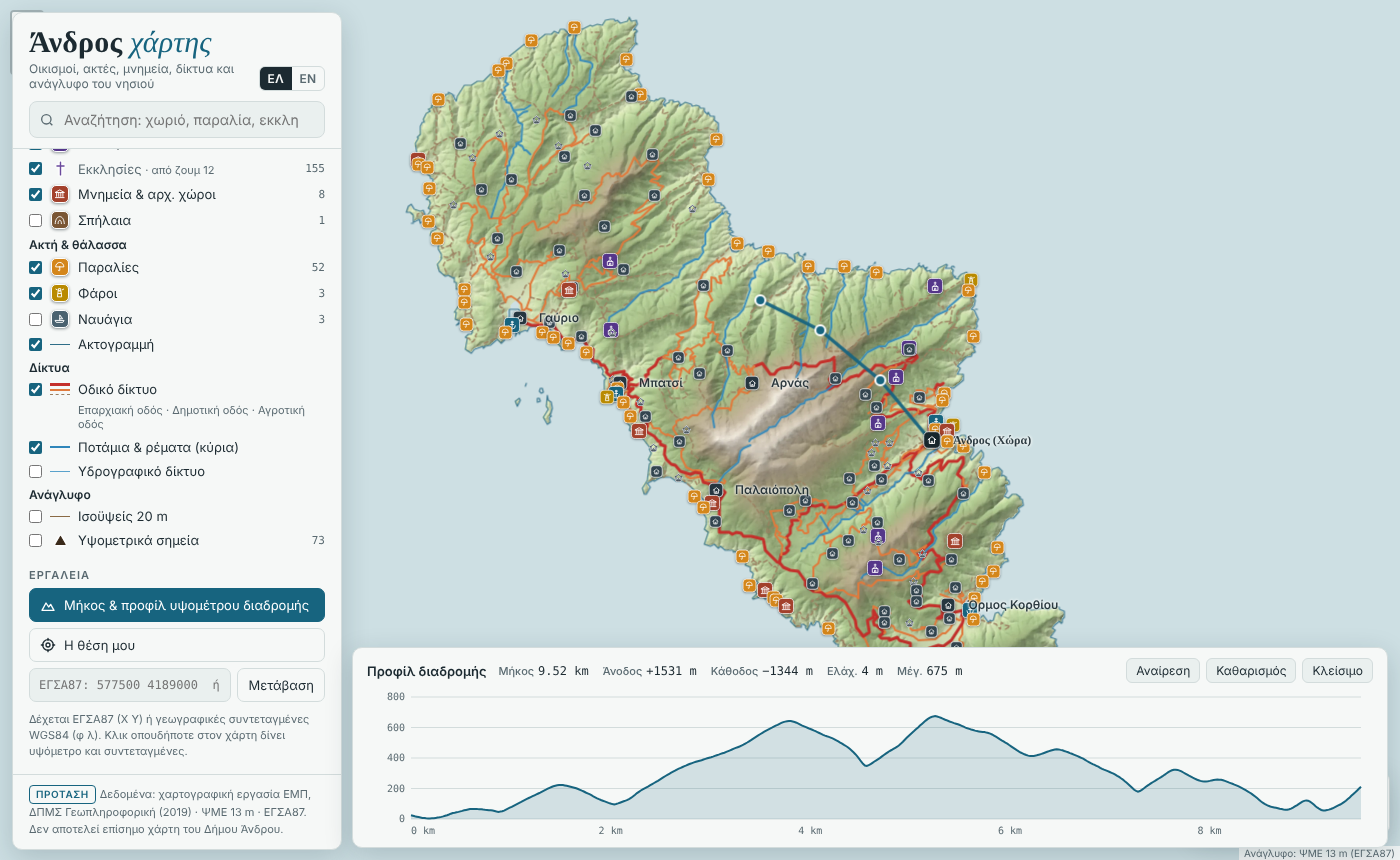
- Draw a route to get its length, ascent, descent and an elevation profile.
- Greek and English, with a search that doesn’t mind accents, and its own symbol for every kind of feature.
- OpenStreetMap layers you can switch on for everyday use: health centres, pharmacies, police and fire stations, municipal offices, fuel, bus stops, springs, viewpoints and the waymarked trails. Each trail opens its own elevation profile.
How I built it
I rebuilt it in Python, coding with Claude: GeoPandas for the vector layers, rasterio for the terrain and Leaflet for the map.
What’s next
I’d like to explore how a map like this could be useful in a council setting, for example for the Municipality of Andros, where a single file can sit inside their existing website with one line of code.