Race to A&E: how quickly can you reach an emergency department in six European capitals?
In an emergency, minutes matter. So I asked a simple question of six European capitals: how long does it take to drive from where people live to the nearest emergency department?
The idea came from Milan Janosov’s animated maps of reachable bakeries in big cities, where the street network grows out from a point and lights up in colour. I wanted to try the same approach on emergency care.
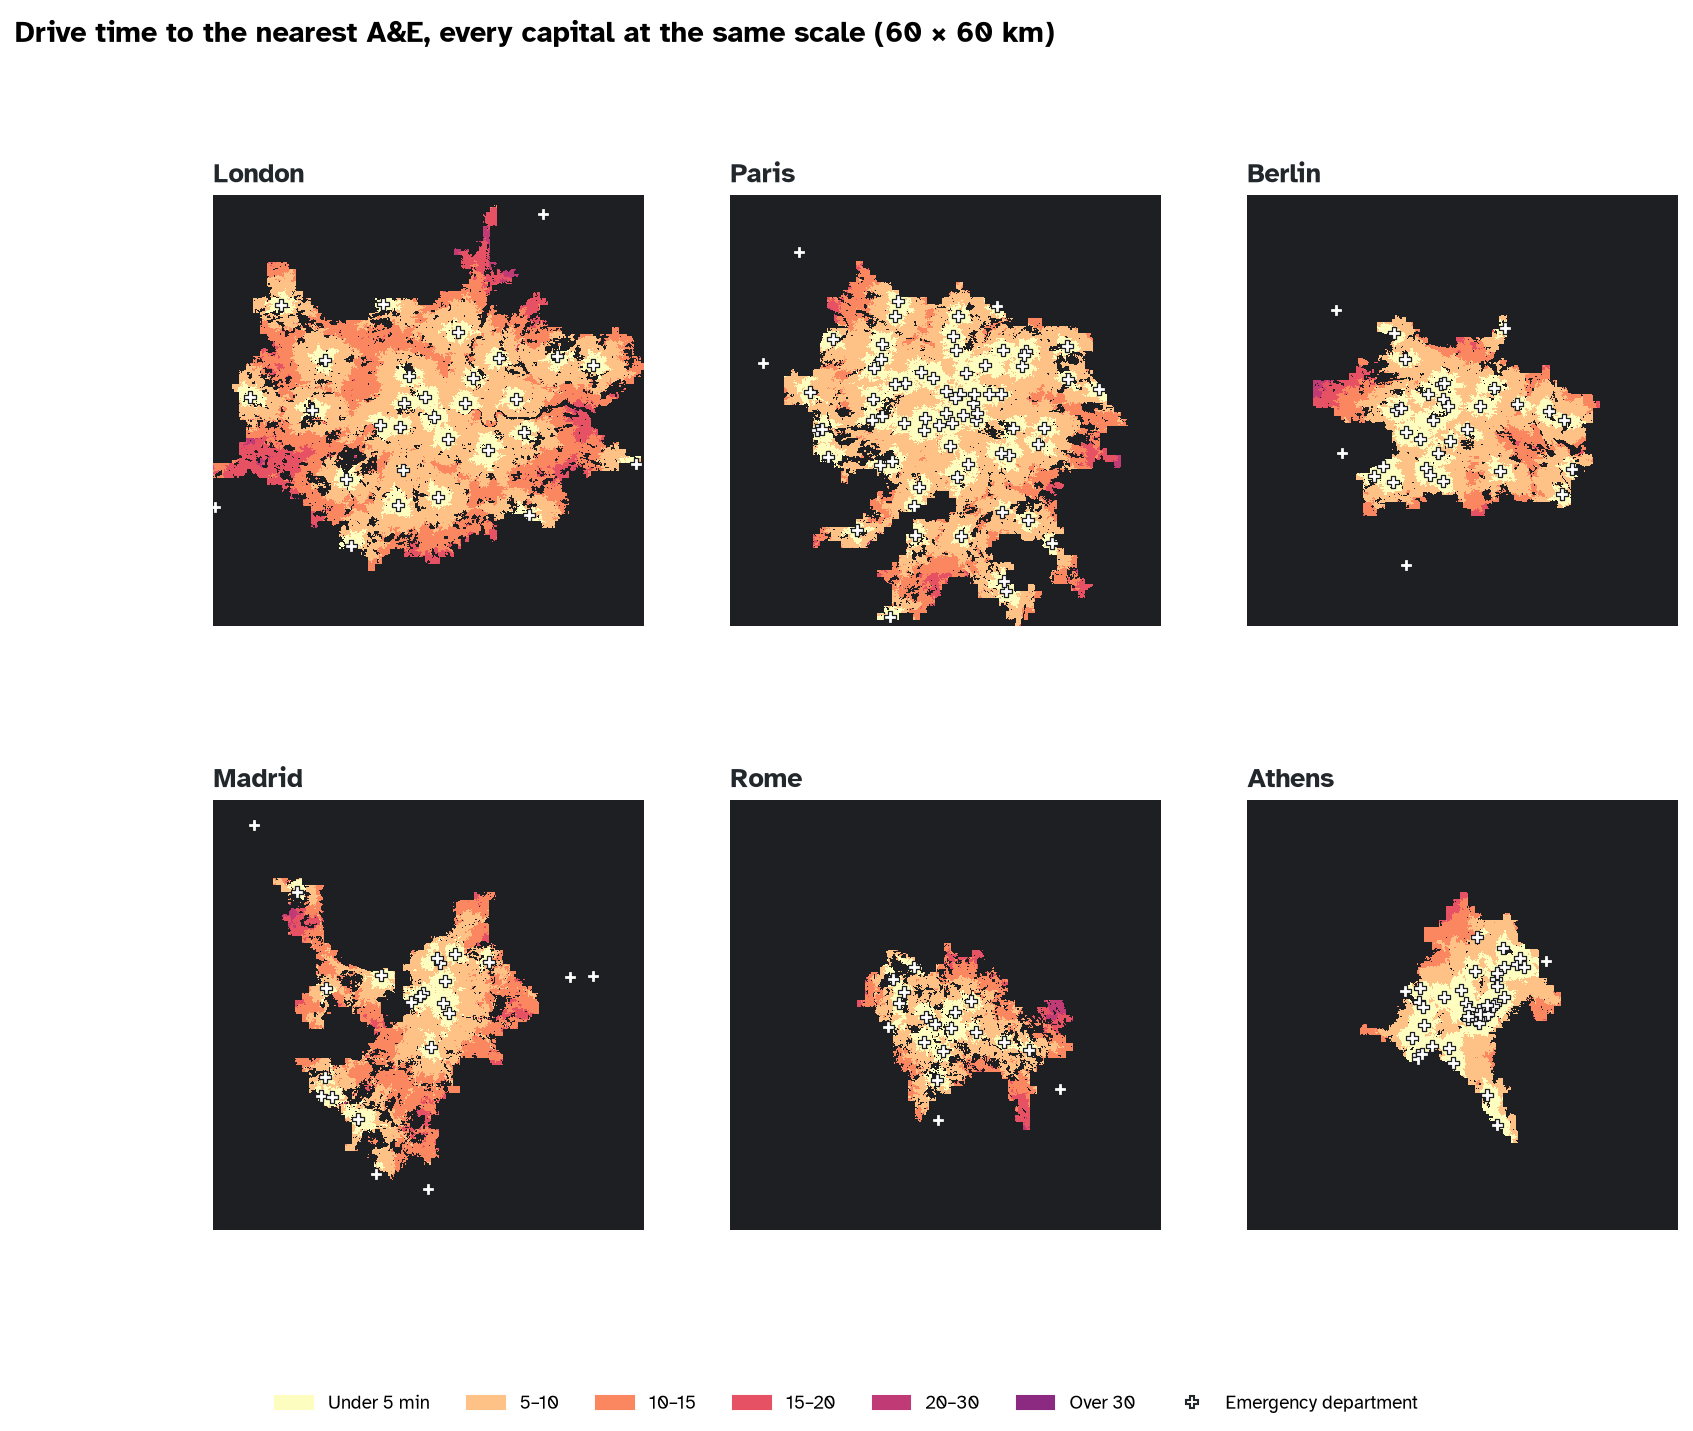
The answer is easier to see than to read. I started the clock at every A&E in each city at the same moment and let the road network light up as each street came within reach. The last streets to light up are the gaps.
All six capitals at once: the clock runs to 30 minutes in about 10 seconds.
Play the race for any of the six cities on the dashboard, switch to busy traffic, or click anywhere to see how far the nearest A&E is.
Comparing like with like
Comparing capitals is harder than it looks, because their administrative boundaries mean very different things: the City of Paris is tiny next to Greater London, and the Municipality of Rome includes farmland. So I used the same definition of a city everywhere, the urban centre from the UN and Eurostat’s Degree of Urbanisation: all the neighbouring square kilometres with at least 1,500 residents each.
- People: the EU’s Global Human Settlement Layer, population per 100 m square for 2025.
- Emergency departments: for Paris and Athens, Eurostat’s European register of healthcare services, compiled from national health ministries and statistics offices, which marks hospitals that provide emergency care; and for London, Berlin, Madrid and Rome, hospitals tagged with an emergency department in OpenStreetMap, which I checked by hand and cleaned (eye hospitals, dental and primary care clinics, a closed A&E and similar sites taken out). Hospitals up to 8 km outside each urban centre count.
- Roads: OpenStreetMap, with the same typical urban driving speeds in every city (lower where a lower limit is posted), and one-way streets respected.
The race
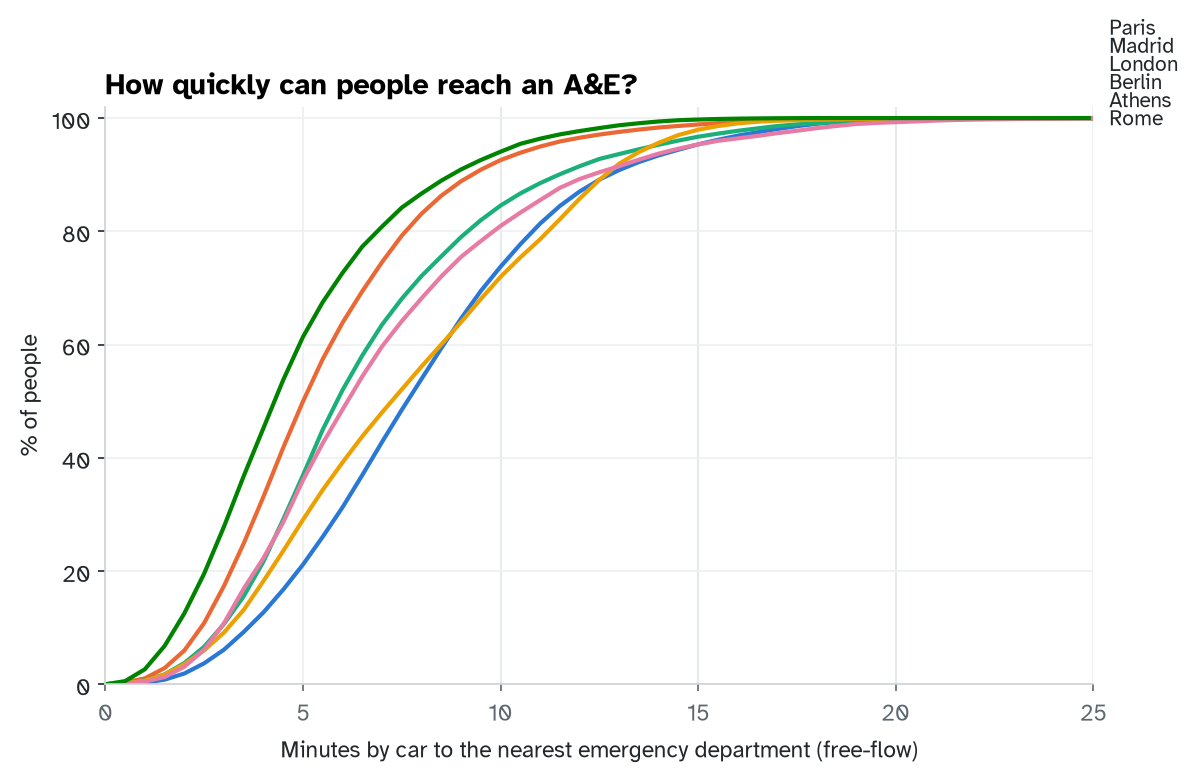
At 15 minutes the race is close: between 95.3% and 99.7% of people in every capital can drive to an emergency department in that time on clear roads. The real differences are in the first ten minutes.
| City | People | A&Es | Within 10 min | Within 15 min | Typical drive (min) | Slowest 10% (min+) |
|---|---|---|---|---|---|---|
| Athens | 3.2m | 45 | 94% | 99.7% | 4.3 | 9 |
| Paris | 9.3m | 71 | 93% | 98.9% | 5.0 | 9 |
| Berlin | 3.5m | 33 | 85% | 96.7% | 5.9 | 11 |
| Rome | 2.4m | 18 | 81% | 95.3% | 6.1 | 12 |
| London | 10.4m | 31 | 74% | 95.4% | 7.6 | 13 |
| Madrid | 5.7m | 23 | 72% | 98.0% | 7.2 | 13 |
Lesson one: the race is won in the first ten minutes
Within ten minutes, 94% of people in Athens can reach an A&E, against 72% in Madrid. The typical (median) drive ranges from 4.3 minutes in Athens to 7.6 in London. For most journeys a few minutes make little difference; for a stroke, a heart attack or a serious bleed, they are exactly the minutes that matter.
Lesson two: it isn’t just how many hospitals
Athens has an emergency department for every 70,000 people in its urban centre; London has one for every 335,000. Yet London still gets 95% of people to an A&E within 15 minutes. What decides the wait is where the hospitals sit relative to where people live, and how well the roads connect them.
Lesson three: rush hour eats the margin
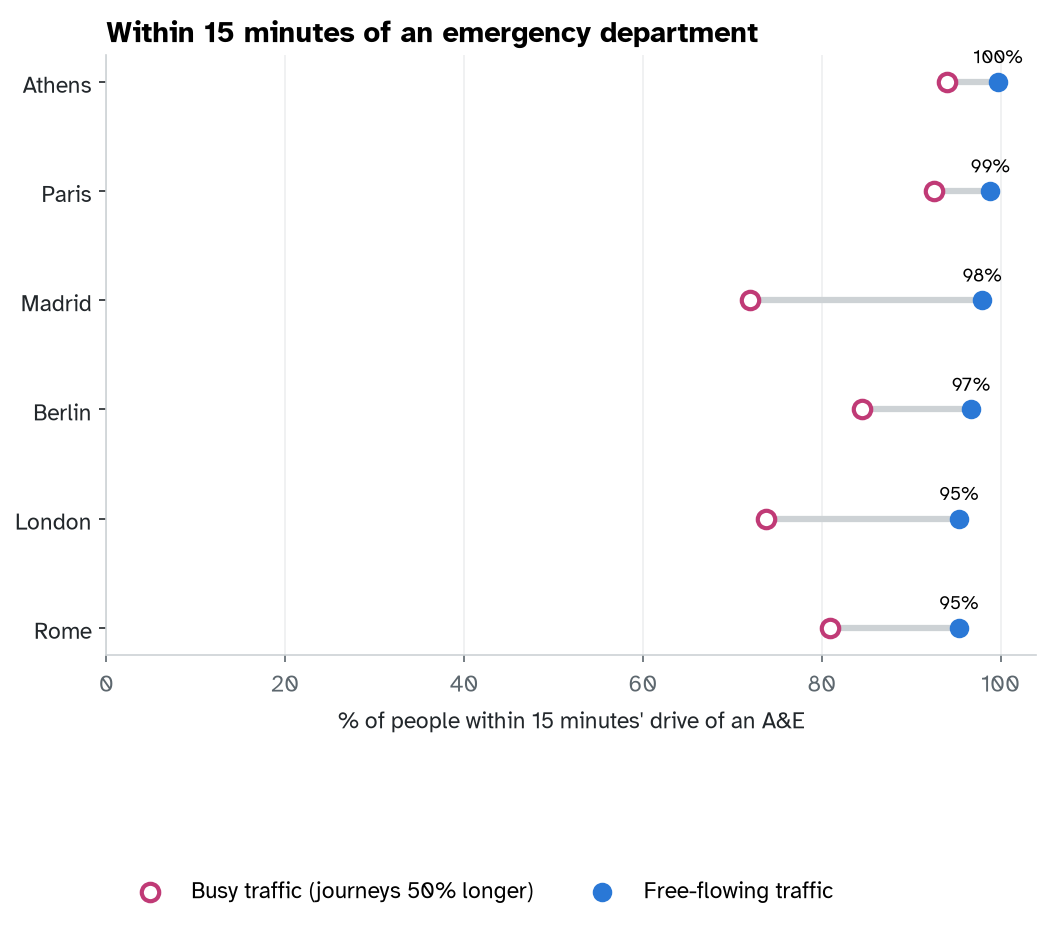
The numbers above assume the roads are clear. If every journey takes 50% longer, being within 15 minutes means being within 10 minutes on clear roads, so the shares fall to the ten-minute column: from 95.3%–99.7% to 72%–94%. Rush hour turns a comfortable margin into a tight one.
What this doesn’t tell you
- These are journeys to hospital, not ambulance response times. Ambulances on blue lights are faster; most people with a broken wrist drive or take a taxi.
- Not every emergency department treats everything. Major trauma, stroke and heart attack care is concentrated in fewer specialist centres.
- Registers differ. Each country defines “emergency care” a little differently, and four of the six lists come from OpenStreetMap.
- Athens hospitals take turns. Greek hospitals share emergency duty on a rota, so on any given day fewer emergency departments take new patients than this map assumes. On a typical day the Athens numbers would be lower.
- Traffic is a single factor. Real congestion varies by street and by hour.
Then and now
My pedestrian safety project measured drive times to London’s four major trauma centres. This time, with Milan Janosov’s animations as the spark, the same idea runs on six capitals, with open data from three different sources, and turns into an animation as well as a table.
As before, I worked with an AI assistant, Claude. The questions, the choice of a fair city definition, the review of the hospital lists and the judgement about what the numbers mean are mine. Everything was tested on a made-up city with known answers before it ran on real ones.
- Watch the race: etymo.co.uk/race-to-ae
- Code and method: github.com/eritrouib/race-to-ae
Data: © OpenStreetMap contributors (ODbL); European Commission JRC, Global Human Settlement Layer GHS-POP R2023A (CC BY 4.0); Eurostat GISCO healthcare services. Drive times assume free-flowing traffic at typical urban speeds.